Data Flow Monitors
Data Flow Monitors help in tracking the flow of data from one event source to another. This becomes particularly crucial when maintaining the integrity of data pipelines and ensuring the smooth operation of data-dependent applications.
Data Flow Rule: Rate
The ‘rate’ rule is utilized in monitoring the data flow and can be broken down into the following types:
- Bytes: This measures the data flow in terms of event size. It helps in ensuring that the size of the events aligns with the expectations. Any significant deviation in the size could indicate problems such as missing data, additional unwanted data, or encoding issues.
- Events: This counts the number of events in the data flow. It provides insights into the activity level of the data source.
- Errors: This keeps track of the number of errors occurring in the data flow. It helps identify issues that may disrupt the data pipeline.
Data Flow Monitor Types
Bytes Rate
By monitoring the bytes rate, you can verify that the size of the events are consistent with expectations. This can help identify issues where data might be missing or additional, unwanted data is being included. It’s an effective way to ensure data integrity and that the events are encoded as expected.
Events Rate
The events rate provides insights into the number of events processed within a specific time frame. A sudden change in this rate could signify an issue with the event source or destination.
Error Rate
The error rate should ideally be zero in a healthy system. An increasing error rate could indicate potential problems in the data pipeline that need to be addressed quickly to avoid data loss or corruption.
Data Flow Monitor Configuration
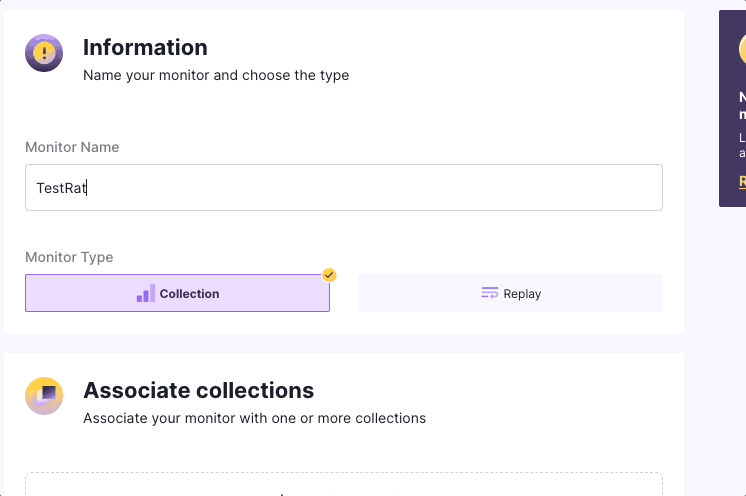
- Navigate to Monitor in the console, and click the
+button to create a new monitor. - Name the monitor.
- Associate the collection you wish to monitor.
- Attach an alert to the monitor.
- Select the monitor rule
Rate. - Select the type - ‘Bytes’, ‘Events’, or ‘Errors’.
- Configure the Threshold and the Timeframe.